
Amazon's Search Query Performance report gives brands first-party market share data — impression, click, cart-add, and purchase share — at the query level, weekly. Here's why it's a stronger framework than any rank tracker, and how Autopilot operates on it.
Every morning, thousands of Amazon brands open a dashboard of green and red arrows, watching keyword ranks twitch up and down across the SERP.
It's a ritual. It's also, increasingly, a waste of time.
Rank tracking was a legitimate breakthrough when Helium 10, Jungle Scout, and Viral Launch shipped their first versions. On 2015–2018 Amazon, the SERP was a relatively stable, mostly organic, desktop-dominant surface. Knowing you had moved from position 14 to position 4 on "stainless steel water bottle" meant something real — and those tools' category-defining keyword research and index-checking features evolved from that foundation.
But in 2026, rank tracking is a false proxy. Amazon changed; the measurement didn't.
Five things have shifted since rank tracking was designed for a simpler Amazon.
Personalization killed "the" rank. A9 became A10, and the SERP is now personalized by browsing history, purchase history, location, device, and time of day. There is no single rank — there are millions of ranks, one per shopper. What a scraper sees from a proxy server in a data center is not what your customer sees.
Mobile rewrote the SERP. Over half of Amazon traffic is mobile, with fewer results per screen, a different click distribution, and different ad density. Most rank trackers still scrape desktop. Your "position 8" might not exist in the world where your customers actually shop.
Algorithm shuffle drowns the signal. A10 constantly tests products in different positions — 4-to-12-to-6 movements that stabilize within 72–96 hours and mean nothing. Teams react to daily noise, adjust bids, and hurt themselves. The data updates frequently; the underlying truth changes much more slowly.
Discovery has left the SERP. Search results are one path to purchase among many: browse nodes, Subscribe & Save, Deals pages, Sponsored Display retargeting, DSP, external traffic, recommendation widgets, and now Rufus. As AI-assisted shopping scales, the fraction of demand flowing through the classical SERP shrinks every quarter. Rank tracking measures an increasingly unrepresentative slice of the business with increasing precision.
Rank tells you nothing about outcomes. A product can rank #1 on a zero-volume keyword. A category can be growing 40% YoY while your ranks are flat. A competitor can launch and eat your share while you sit happily at position 2. Rank is a proxy for visibility, visibility is a proxy for traffic, and traffic is a proxy for sales. Three layers of abstraction from what you actually care about.
Even the rank-tracker vendors themselves are quietly migrating — adding "Share of Voice" and "Share of Shelf" modules alongside the legacy rank feature. That's not an accident. They know.
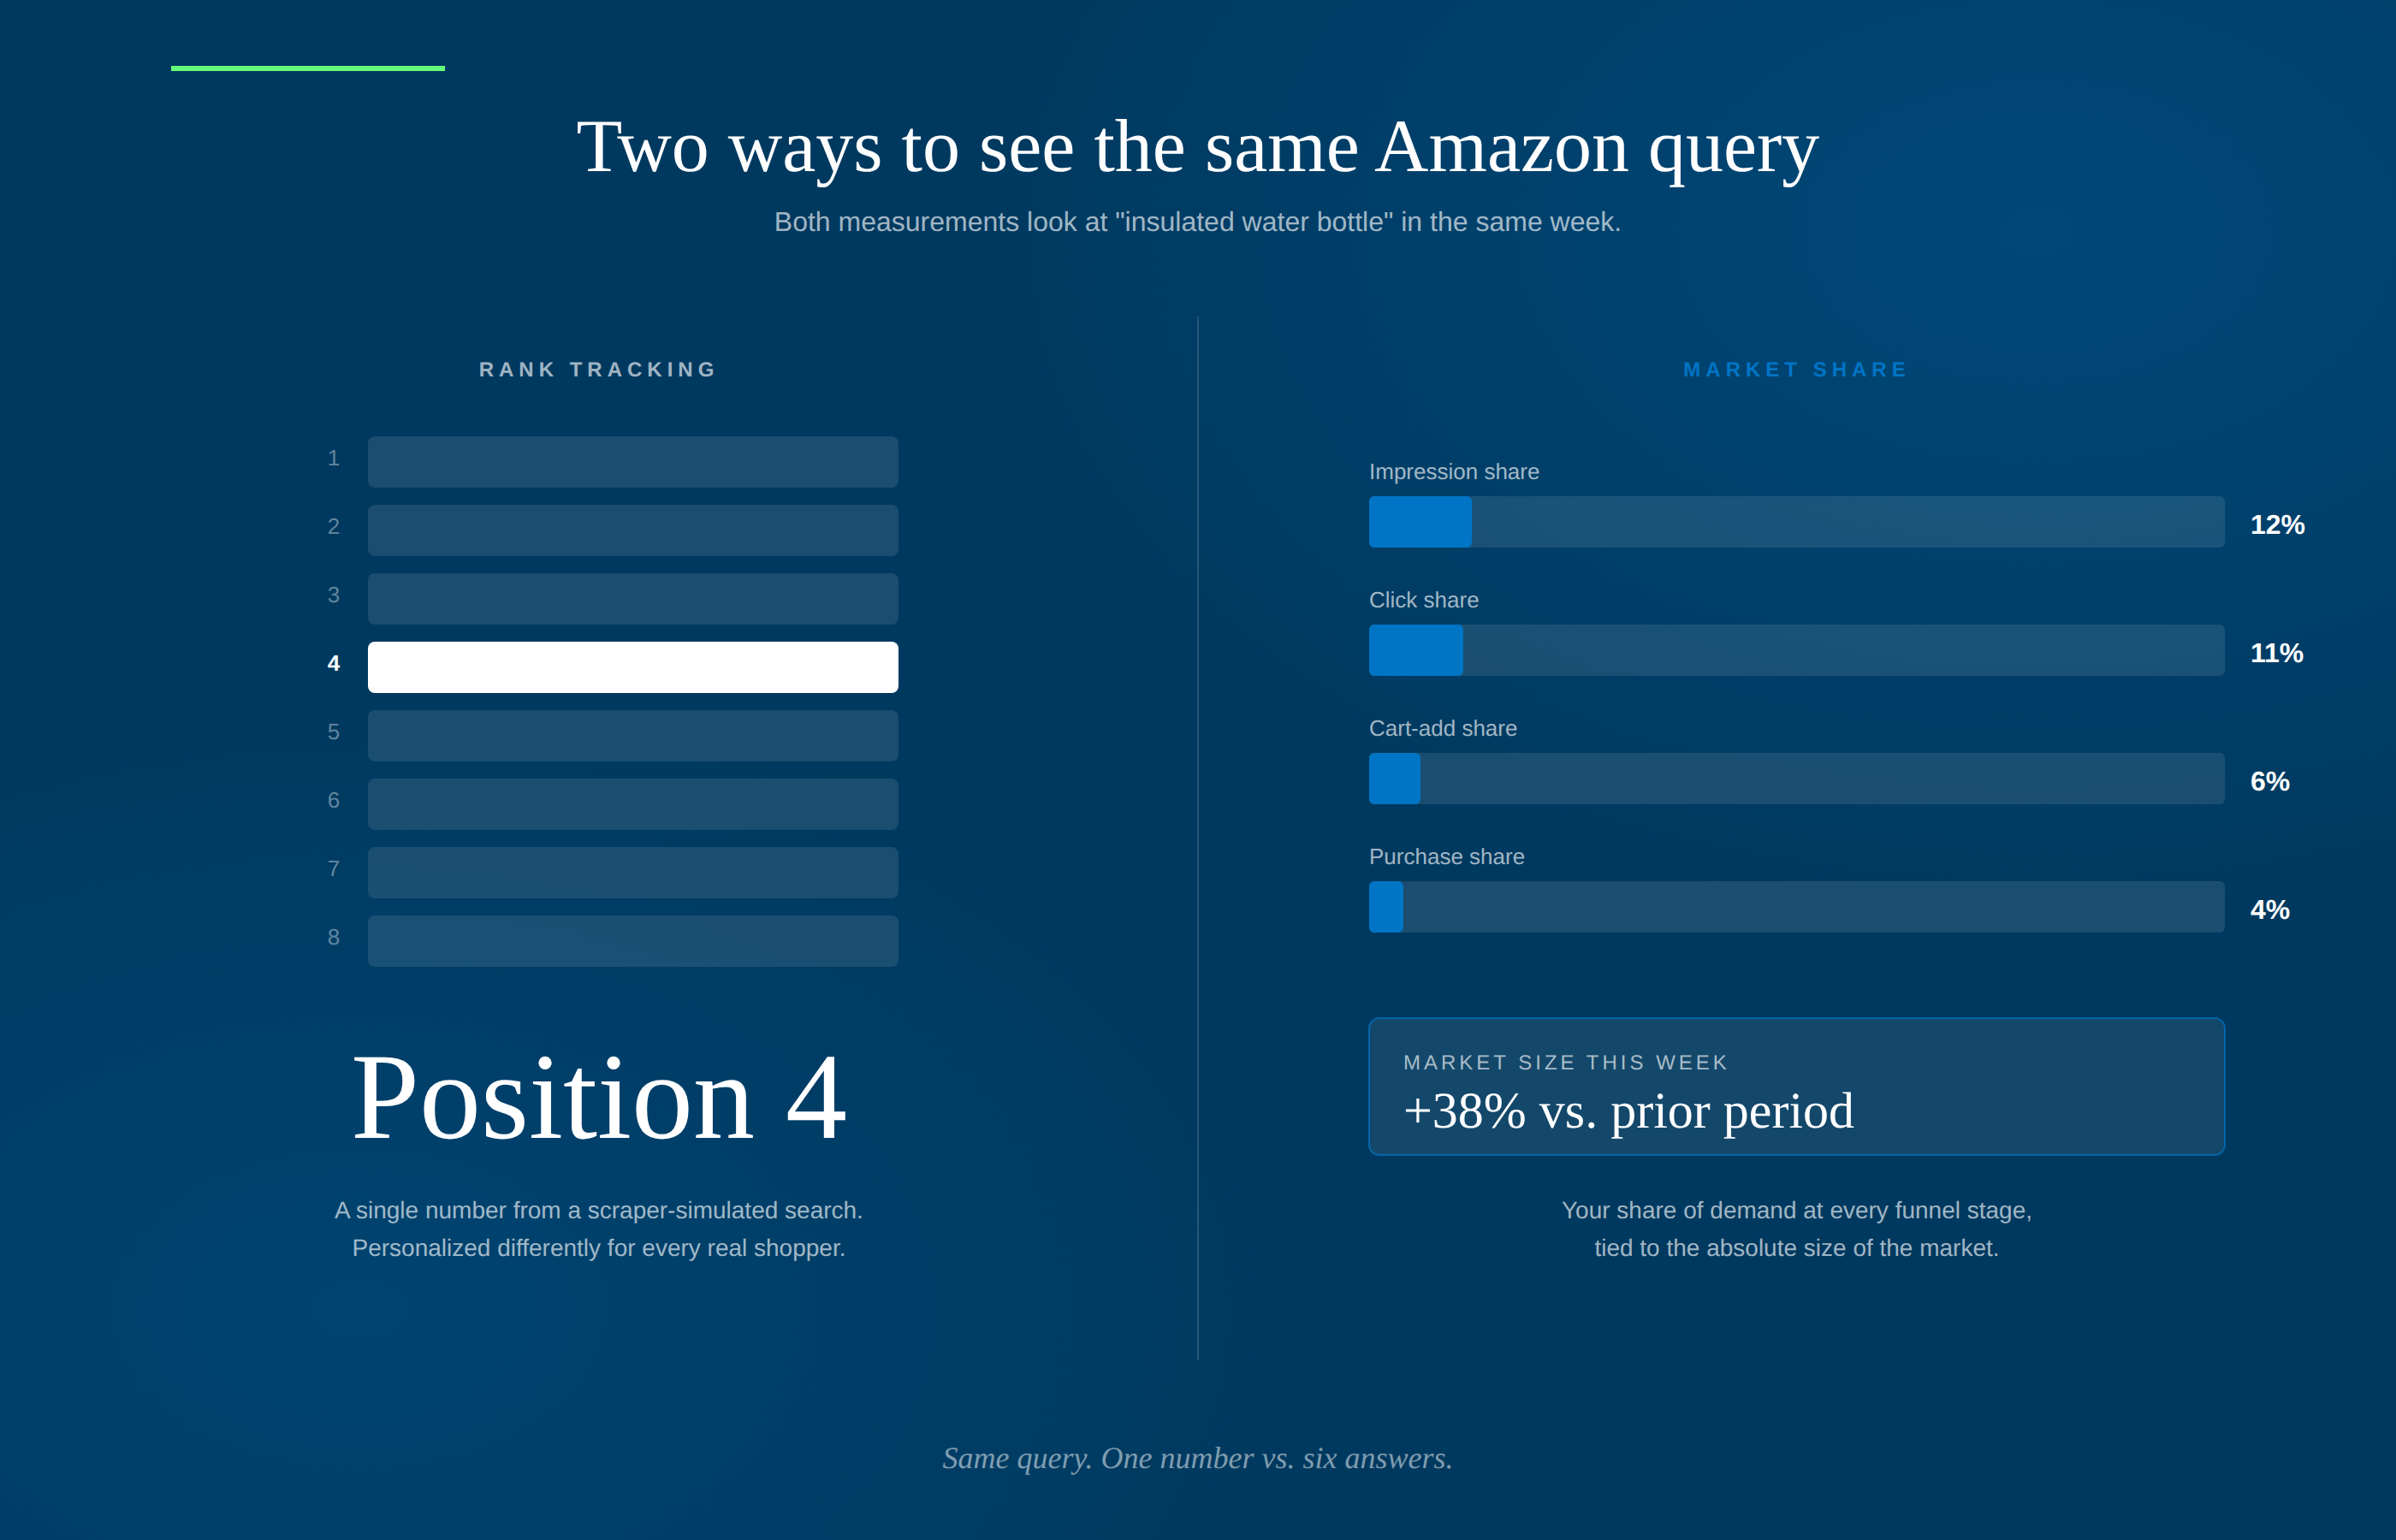
The question every Amazon brand should be asking isn't "where do I rank?" It's "what share of demand am I capturing?"
Amazon already gives you the answer. If you have Brand Registry, the Amazon Search Query Performance (SQP) report in Brand Analytics is the most important dataset most brands are under-using. It's first-party data, tied to your ASINs, reporting exactly what happened when real shoppers typed real queries. No scraping. No proxies. No desktop/mobile mismatch. No 72-hour shuffle artifacts. Accessible in Seller Central and via SP-API, going back two years.
For every ASIN, across its top 100 search queries, SQP delivers four numbers weekly:
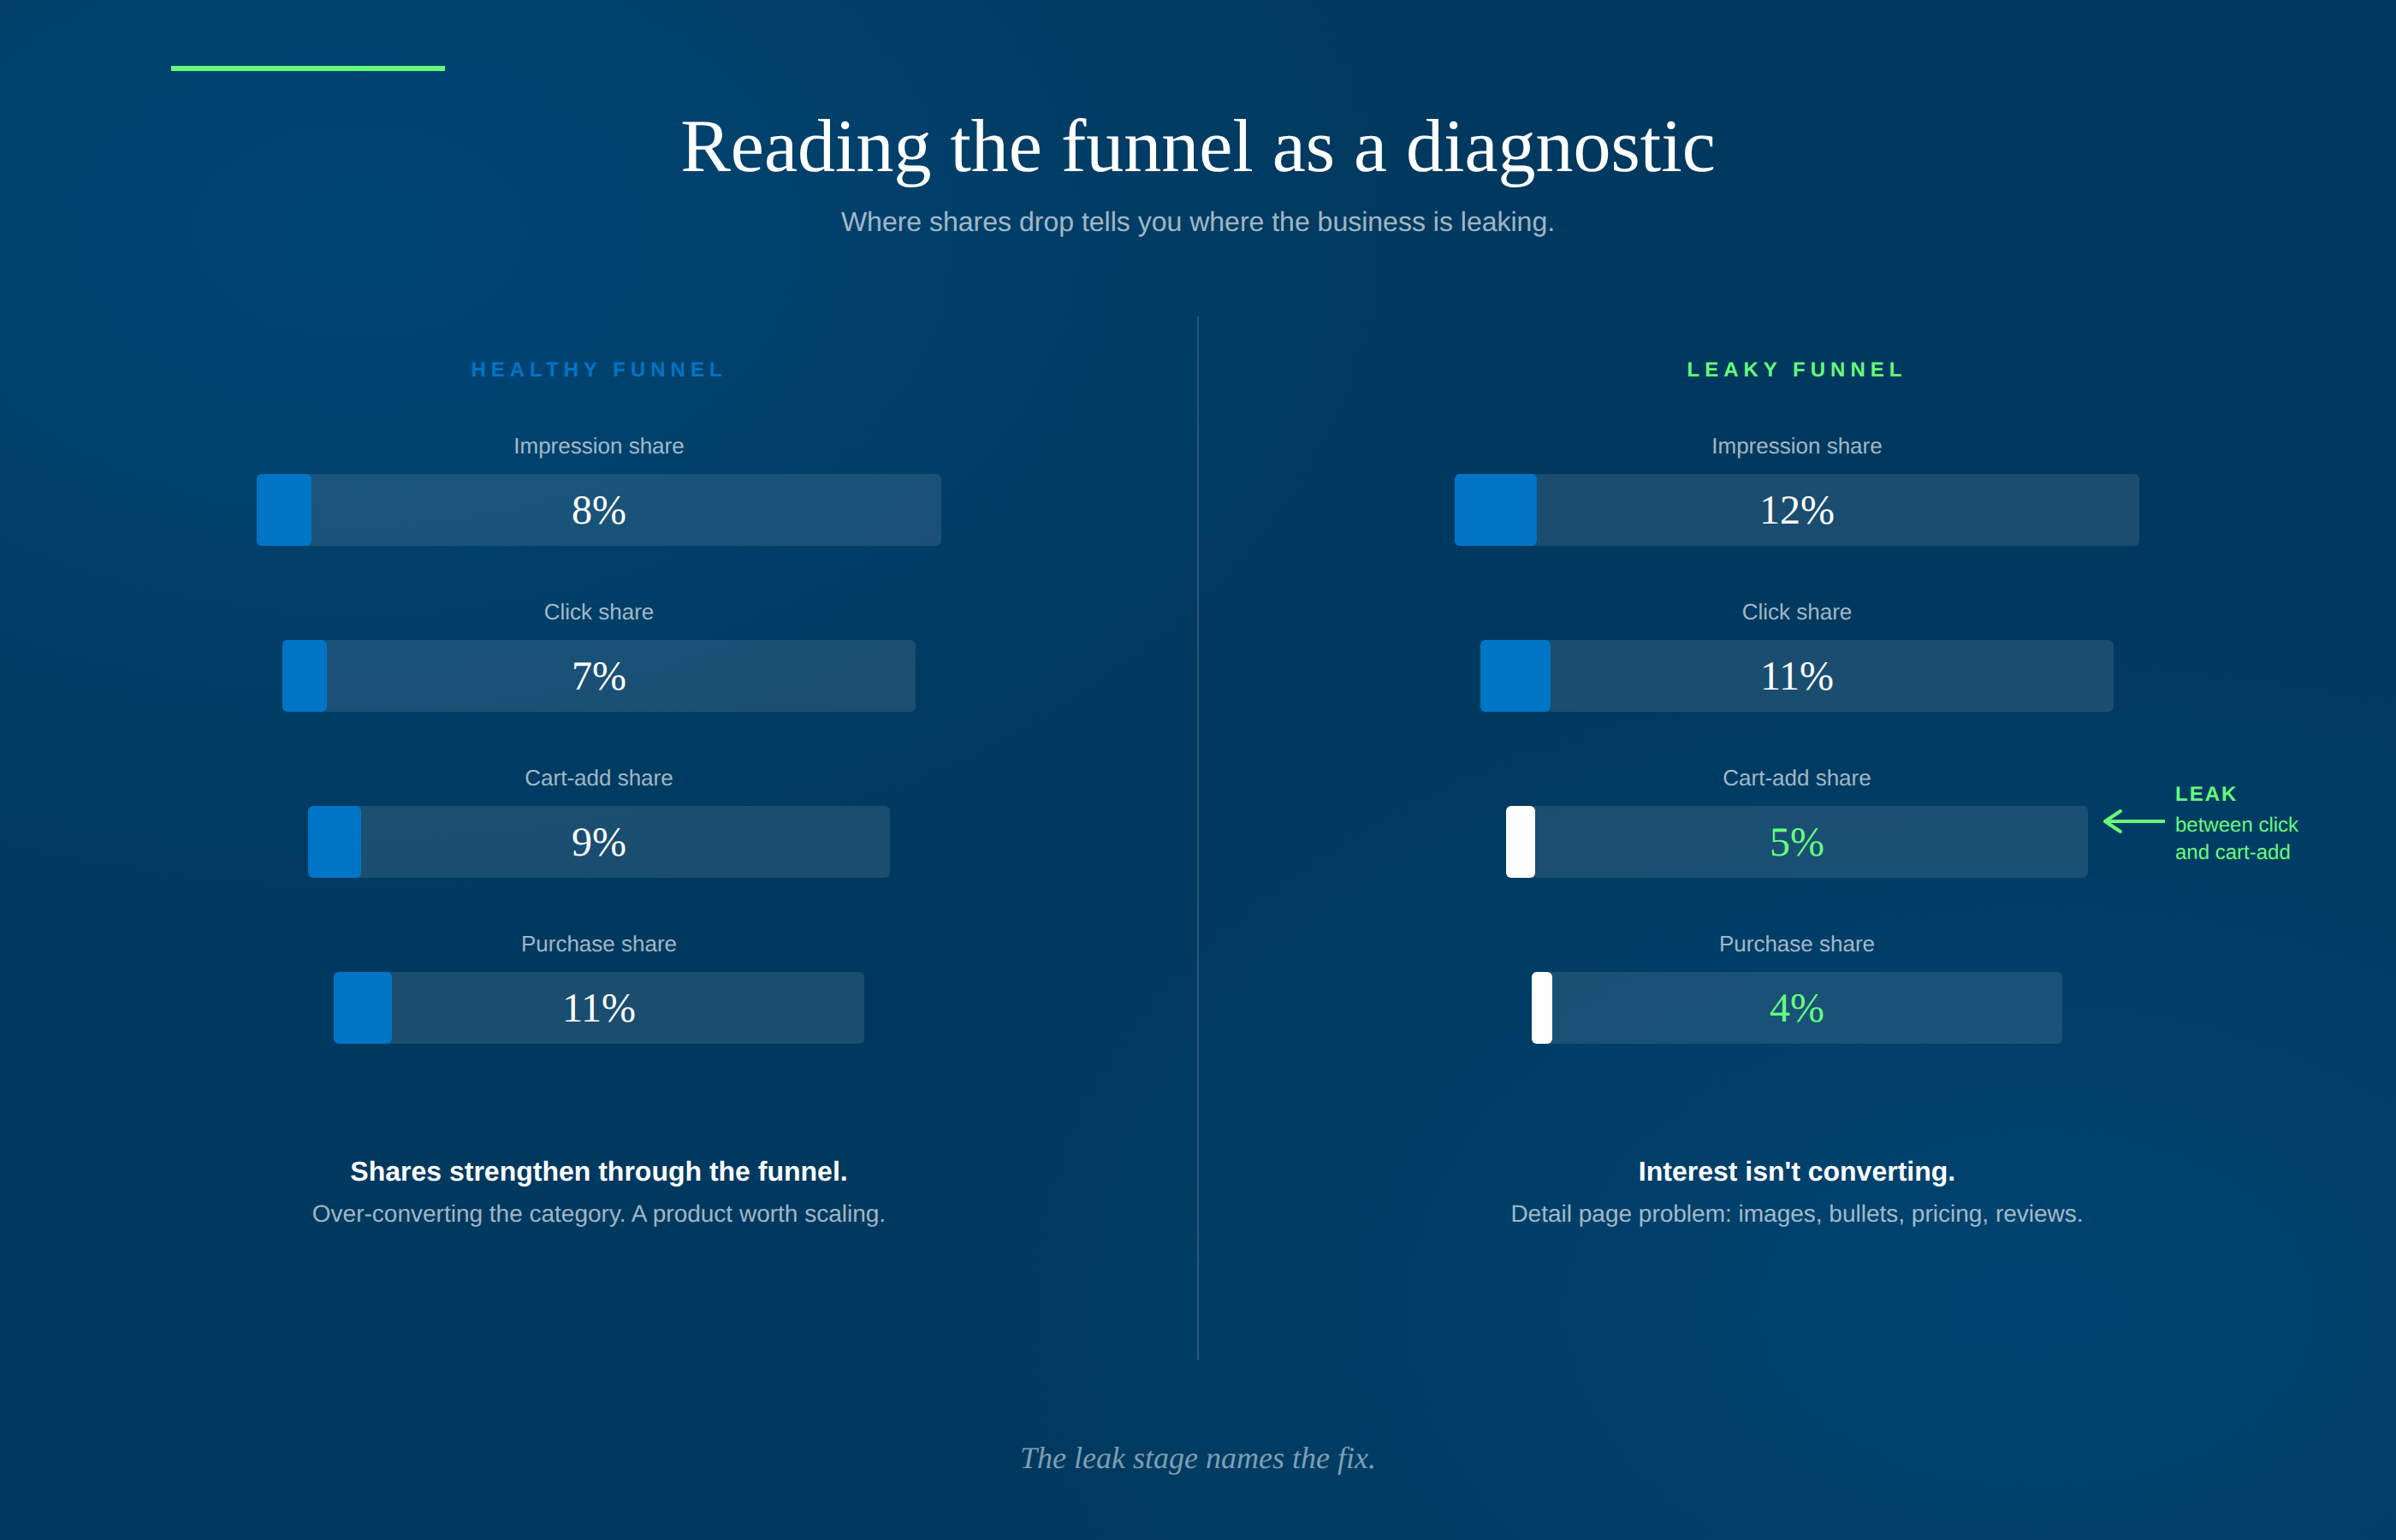
These four numbers are not a dashboard. They're a diagnostic funnel.
If your shares stay roughly constant through the funnel — 8% impressions, 7% clicks, 8% cart-adds, 7% purchases — you're competing at category par. If shares rise through the funnel (5% impressions, 9% purchases), you're over-converting: every shopper who finds you is disproportionately likely to buy.
That's a product worth scaling.
If shares fall through the funnel (12% impressions, 4% purchases), you're subsidizing competitors' conversion with your visibility.
That's a product leaking profit.
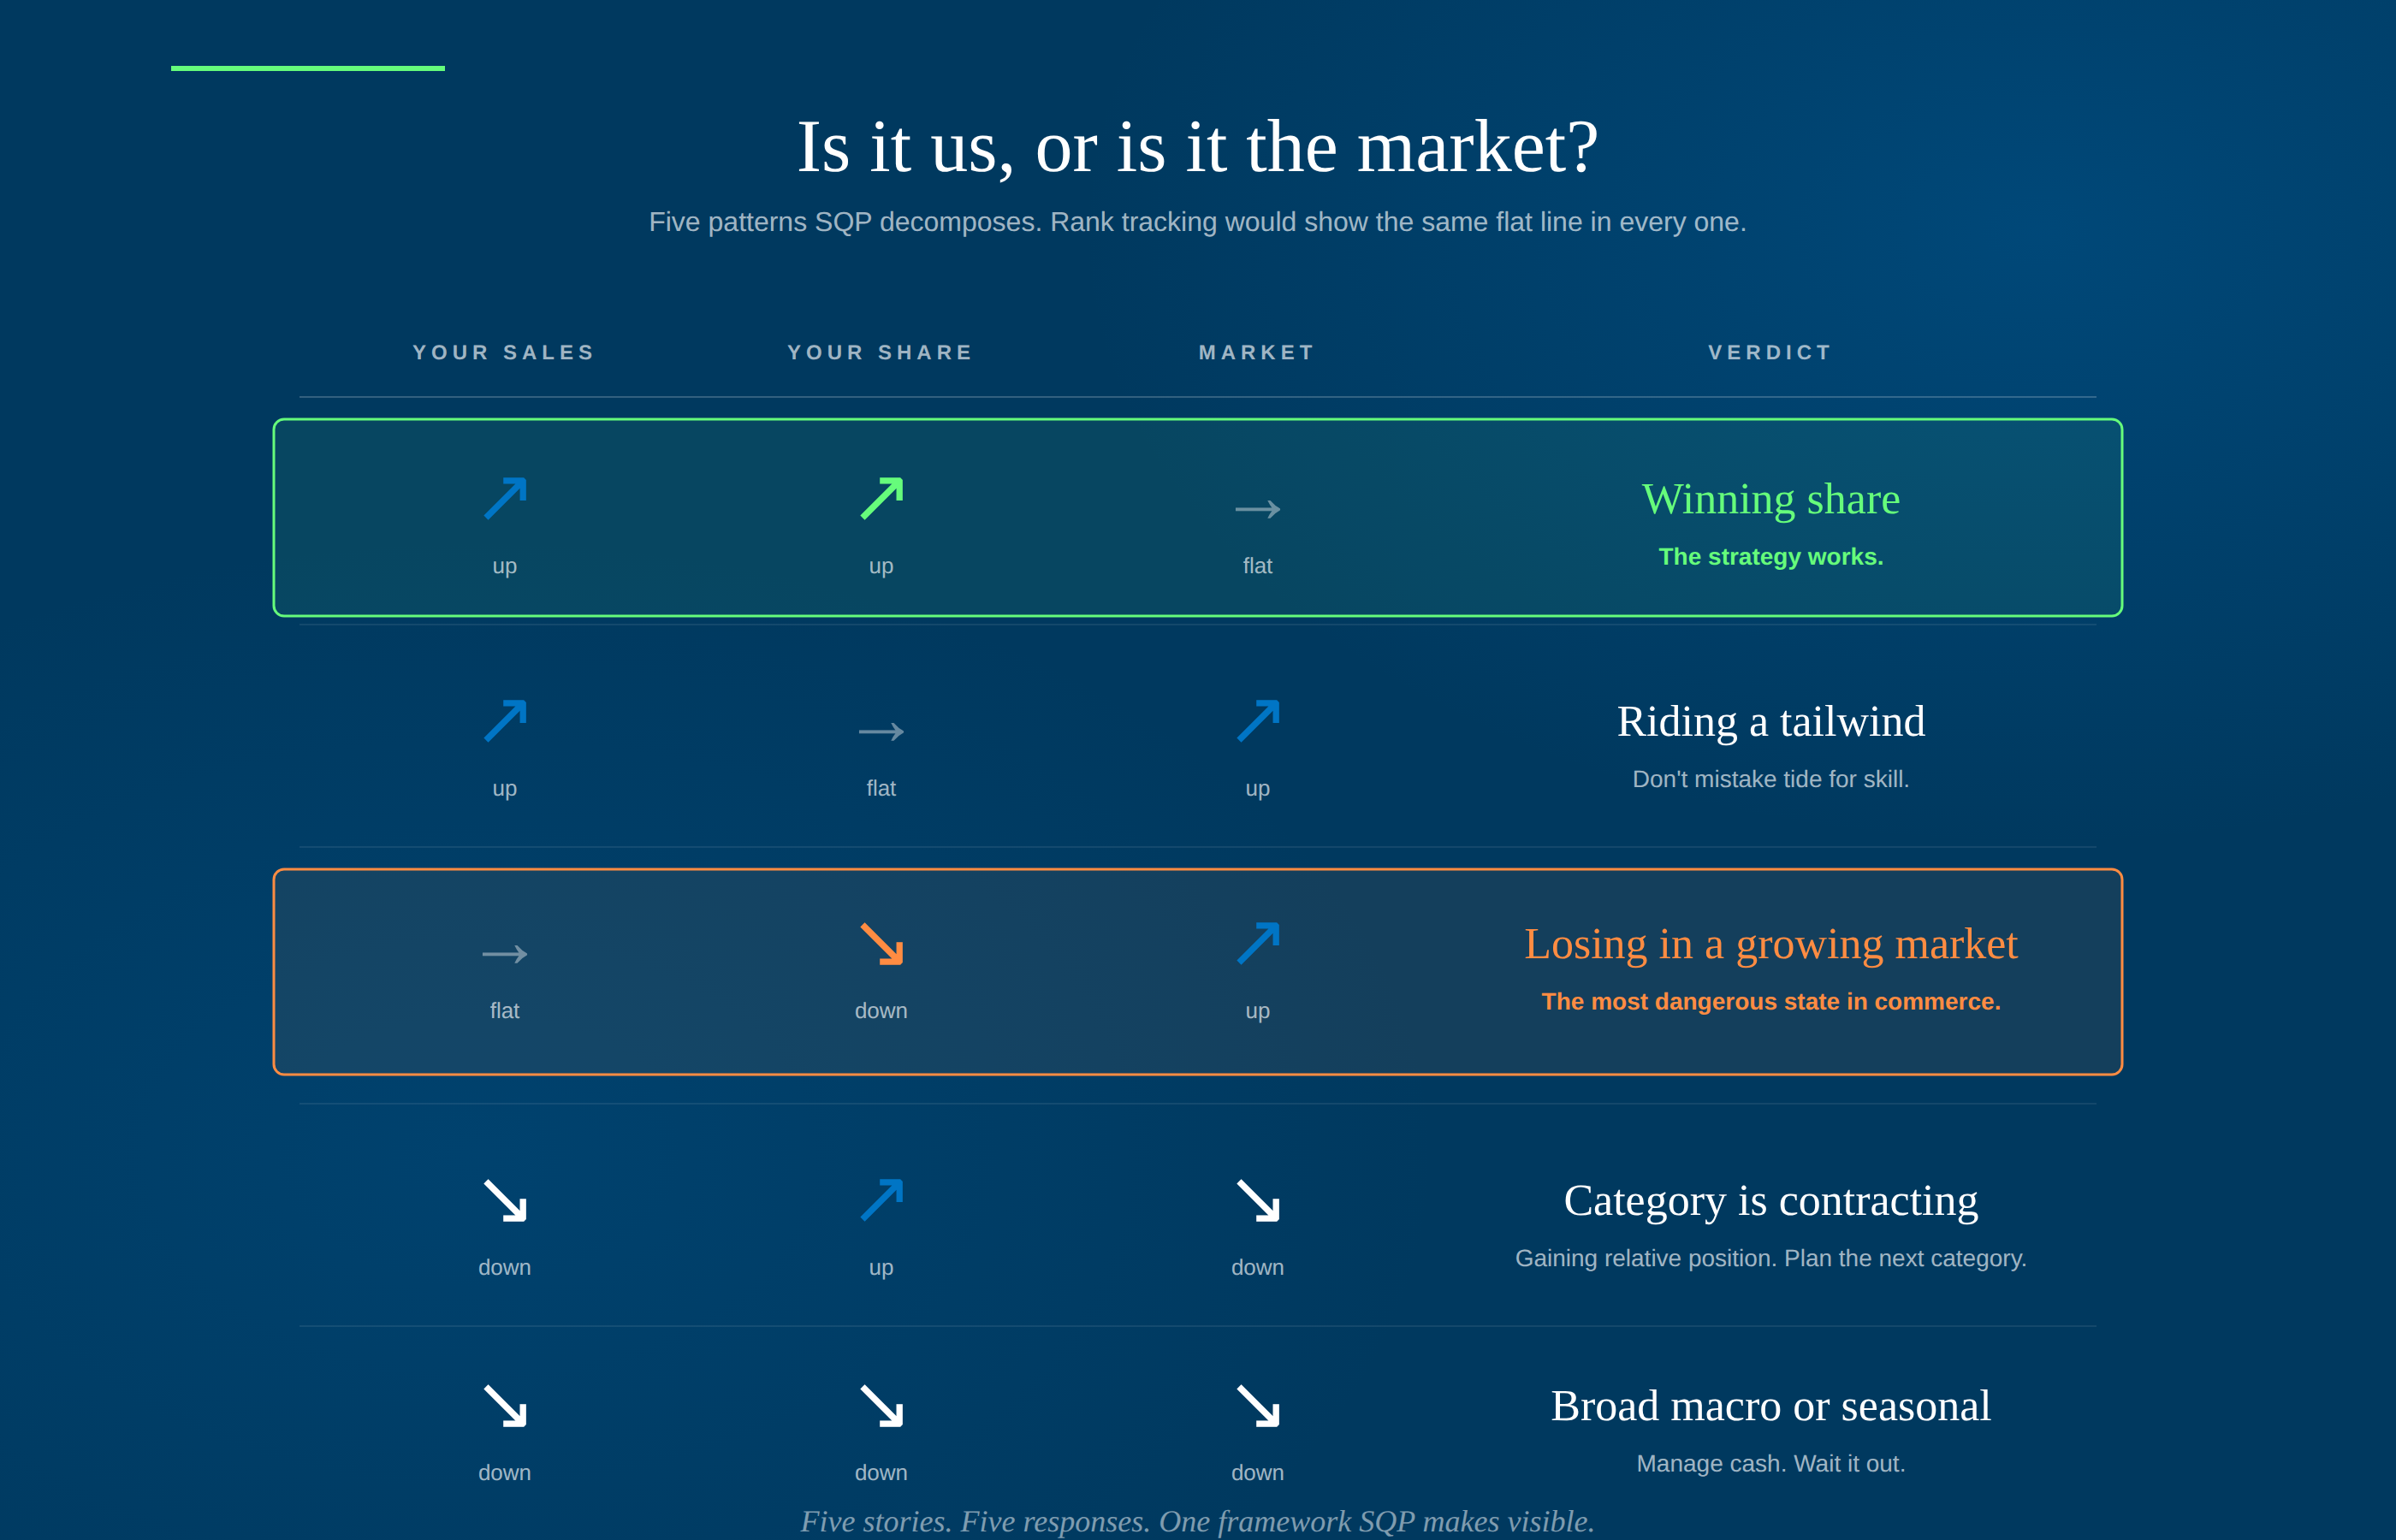
The patterns are clean and immediately actionable:
Every keyword that matters to your business, every week, with data Amazon gives you for free. Try doing any of that with a rank tracker.
Here's the point that actually buries rank tracking as a methodology.
SQP doesn't just give you share. It gives you Total Count (the market's absolute volume for each query) and Brand Count (your absolute volume). Which means every week, for every query, you can decompose your business into two independent variables: your share and the market size.
That decomposition answers the one question every brand operator actually needs answered — is it us, or is it the market?
A rank tracker will show you a flat green line in all five of those scenarios if your SERP position didn't change. A share-and-size view tells you exactly which one you're in and what to do about it.
There's one more cut that matters: branded vs unbranded.
Winning purchase share on "YourBrand water bottle" is loyalty harvest.
Winning purchase share on "stainless steel water bottle" is category conquest. Only one of those builds a durable business — and only SQP lets you separate them cleanly.
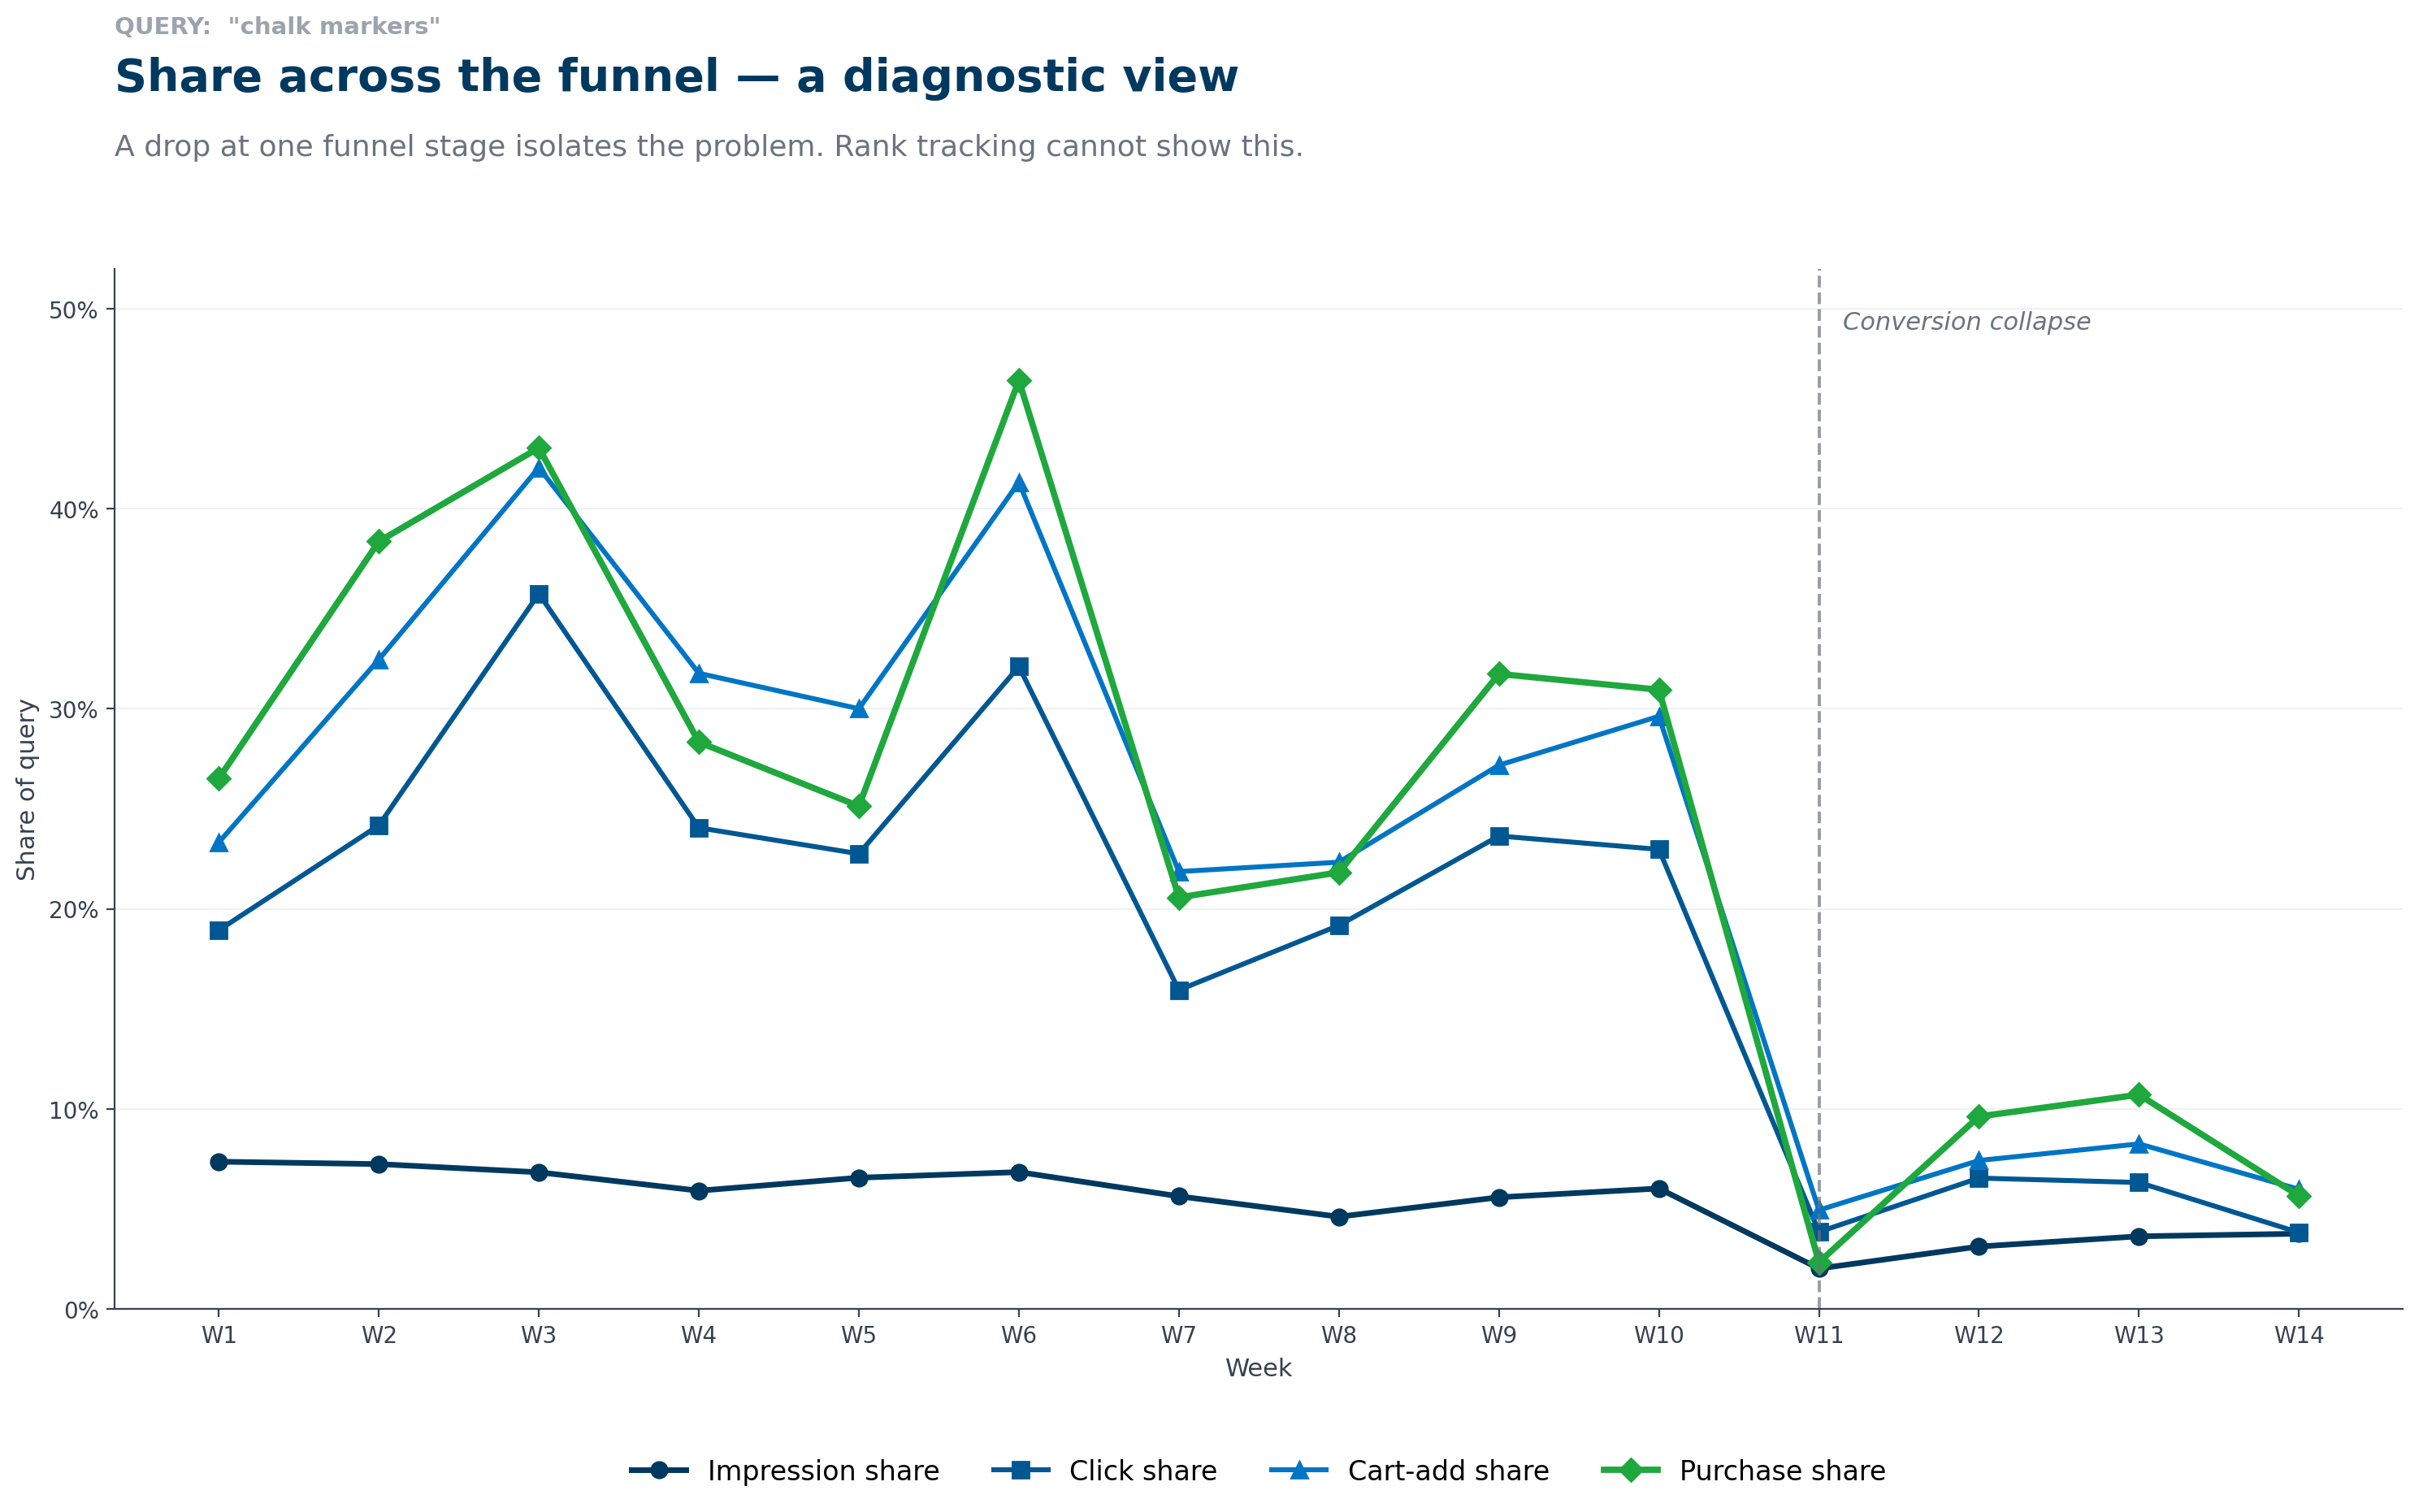
Three queries. Three patterns SQP reveals in a single chart. Three things a rank tracker cannot show you.
Each example below uses anonymized SQP data — brand names redacted, queries neutralized to the category level, effect sizes preserved.
Example 1 — The funnel diagnostic. Impression share holds at 5–7% across ten reporting periods. Placement hasn't moved. Then, in a single period, click, cart-add, and purchase shares collapse in lockstep — all three converge toward impression share. That convergence is the diagnostic signature of a conversion break, not a visibility loss. Which stage owns the leak tells you whether to fix the SERP tile, the detail page, or the close. A rank tracker reports nothing changed.
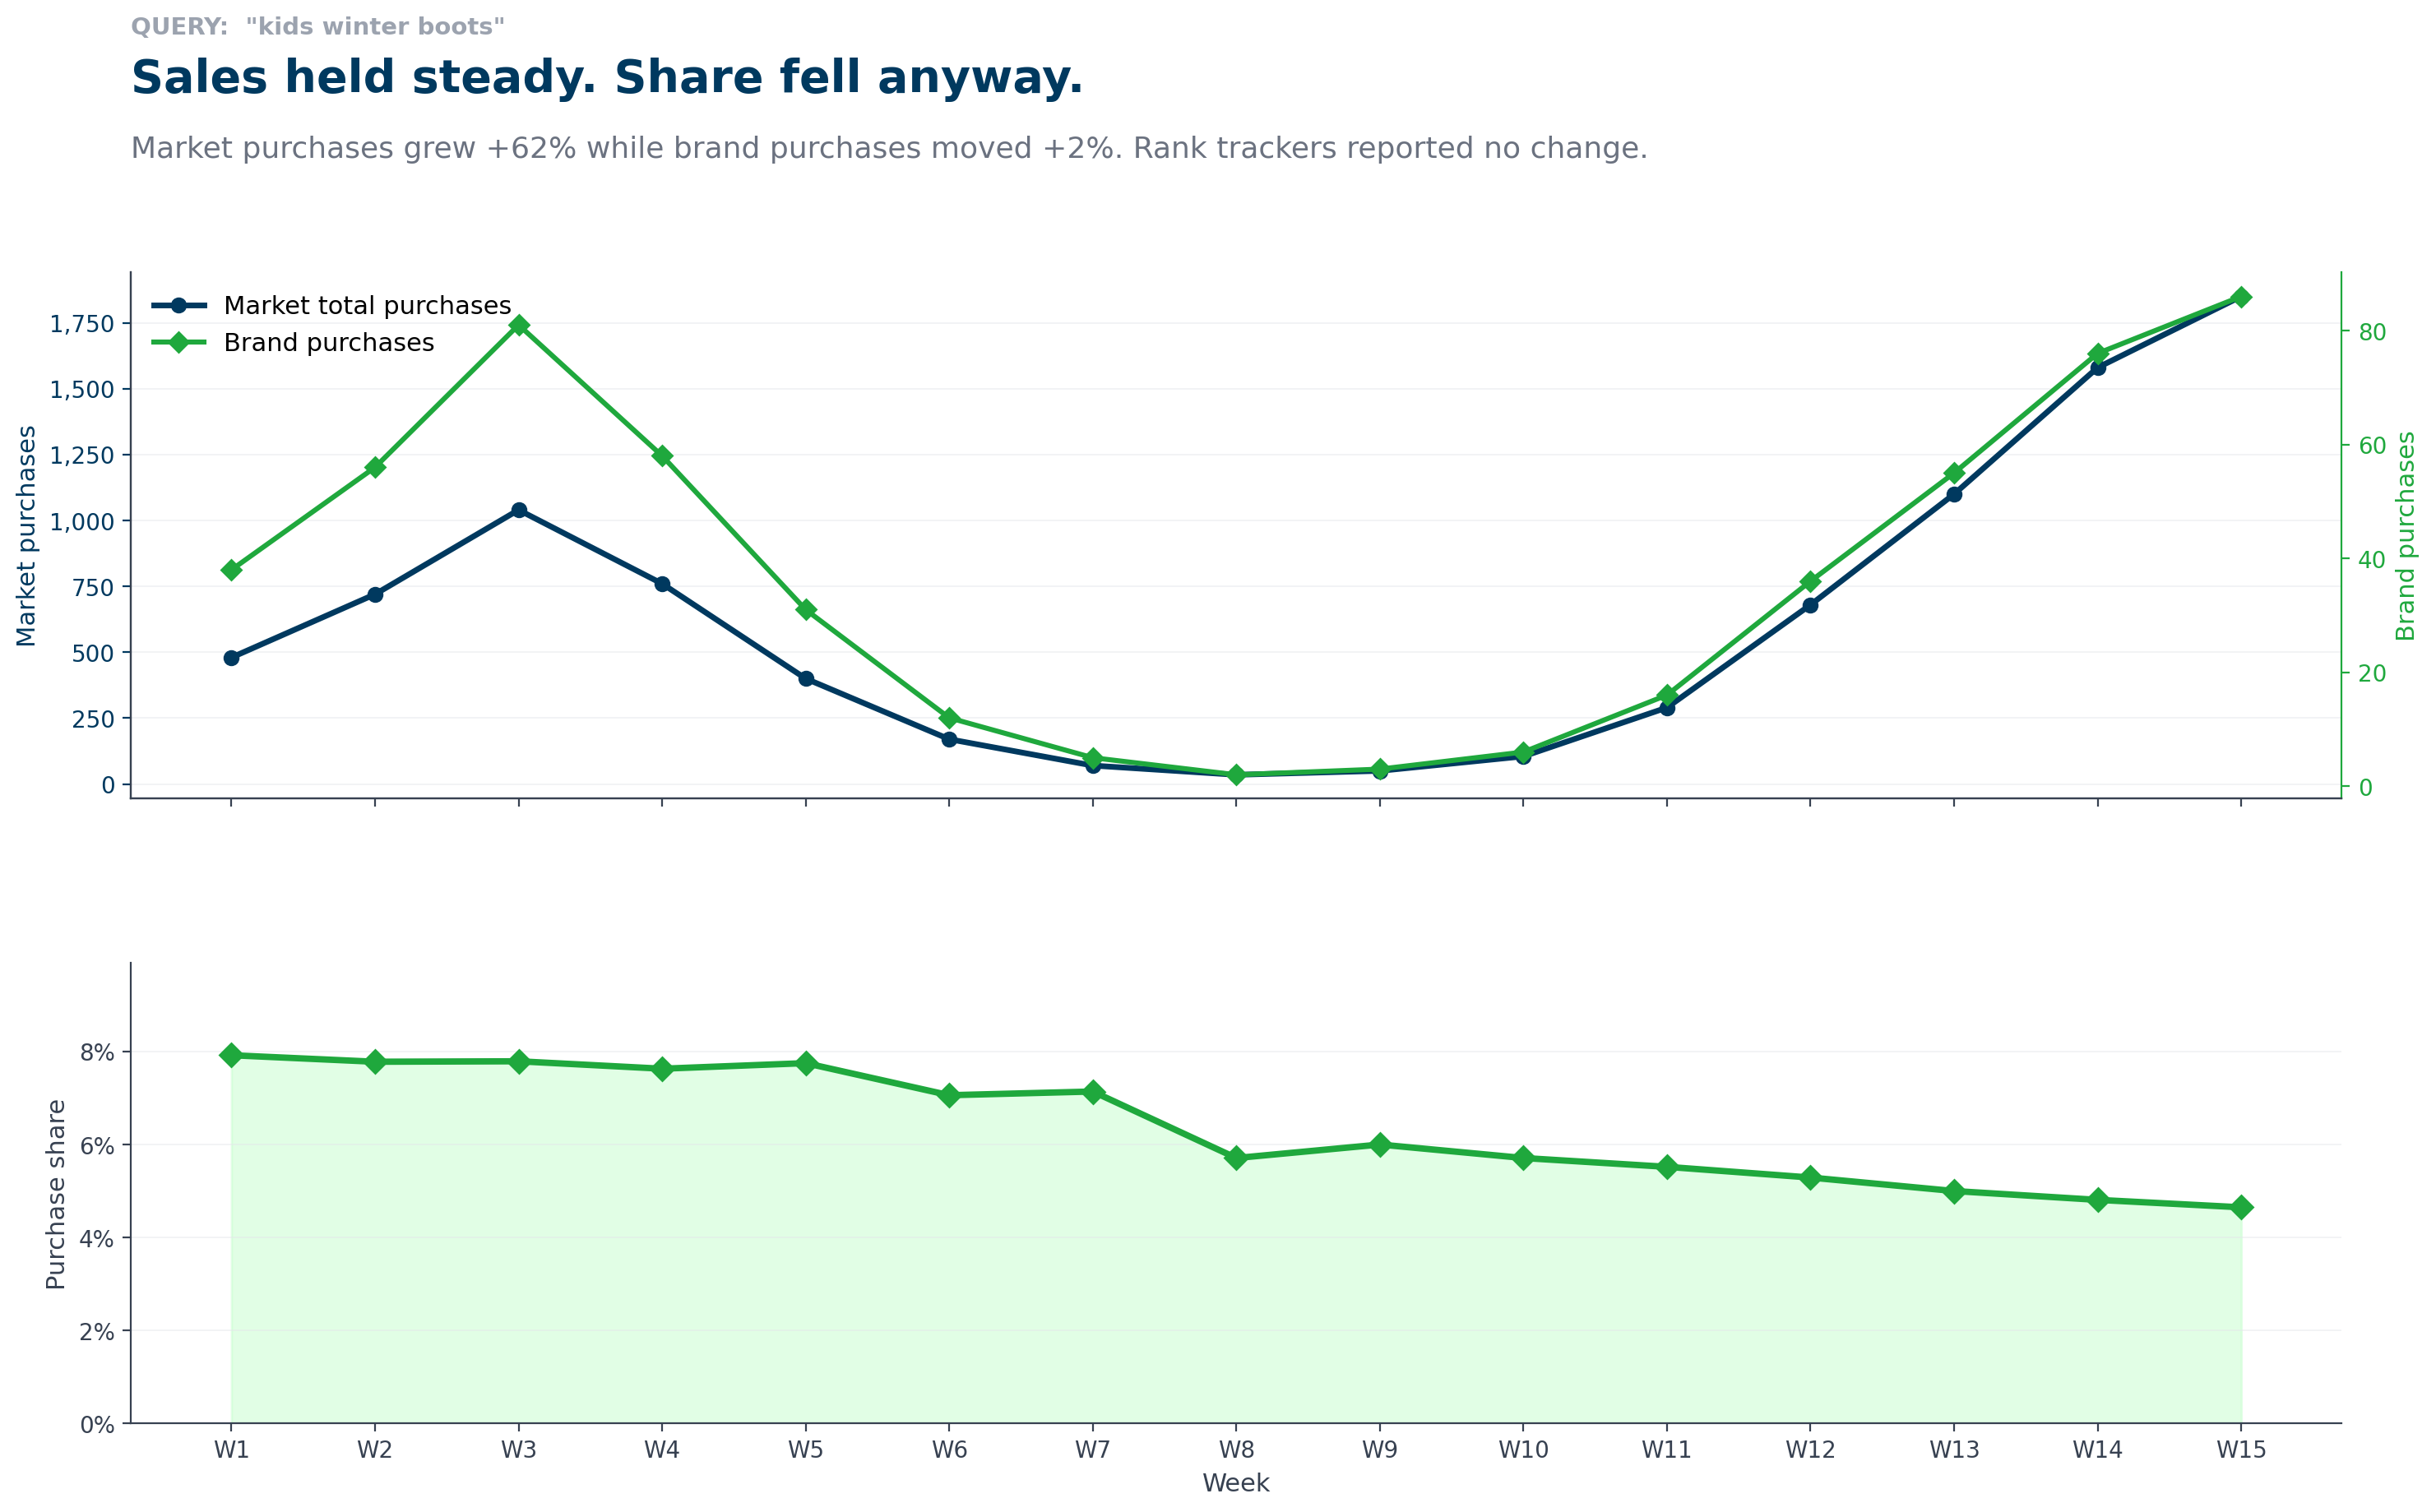
Example 2 — Share vs. market. On a competitive unbranded query, the brand's absolute purchases are essentially flat year-over-year (+2%). Every rank dashboard reports green. SQP's denominator tells a different story: the category grew +62% over the same window. Share fell from 7.8% to 5.1%. The brand didn't fail to grow — it failed to grow as fast as its market. Invisible to rank. Unmissable in SQP.
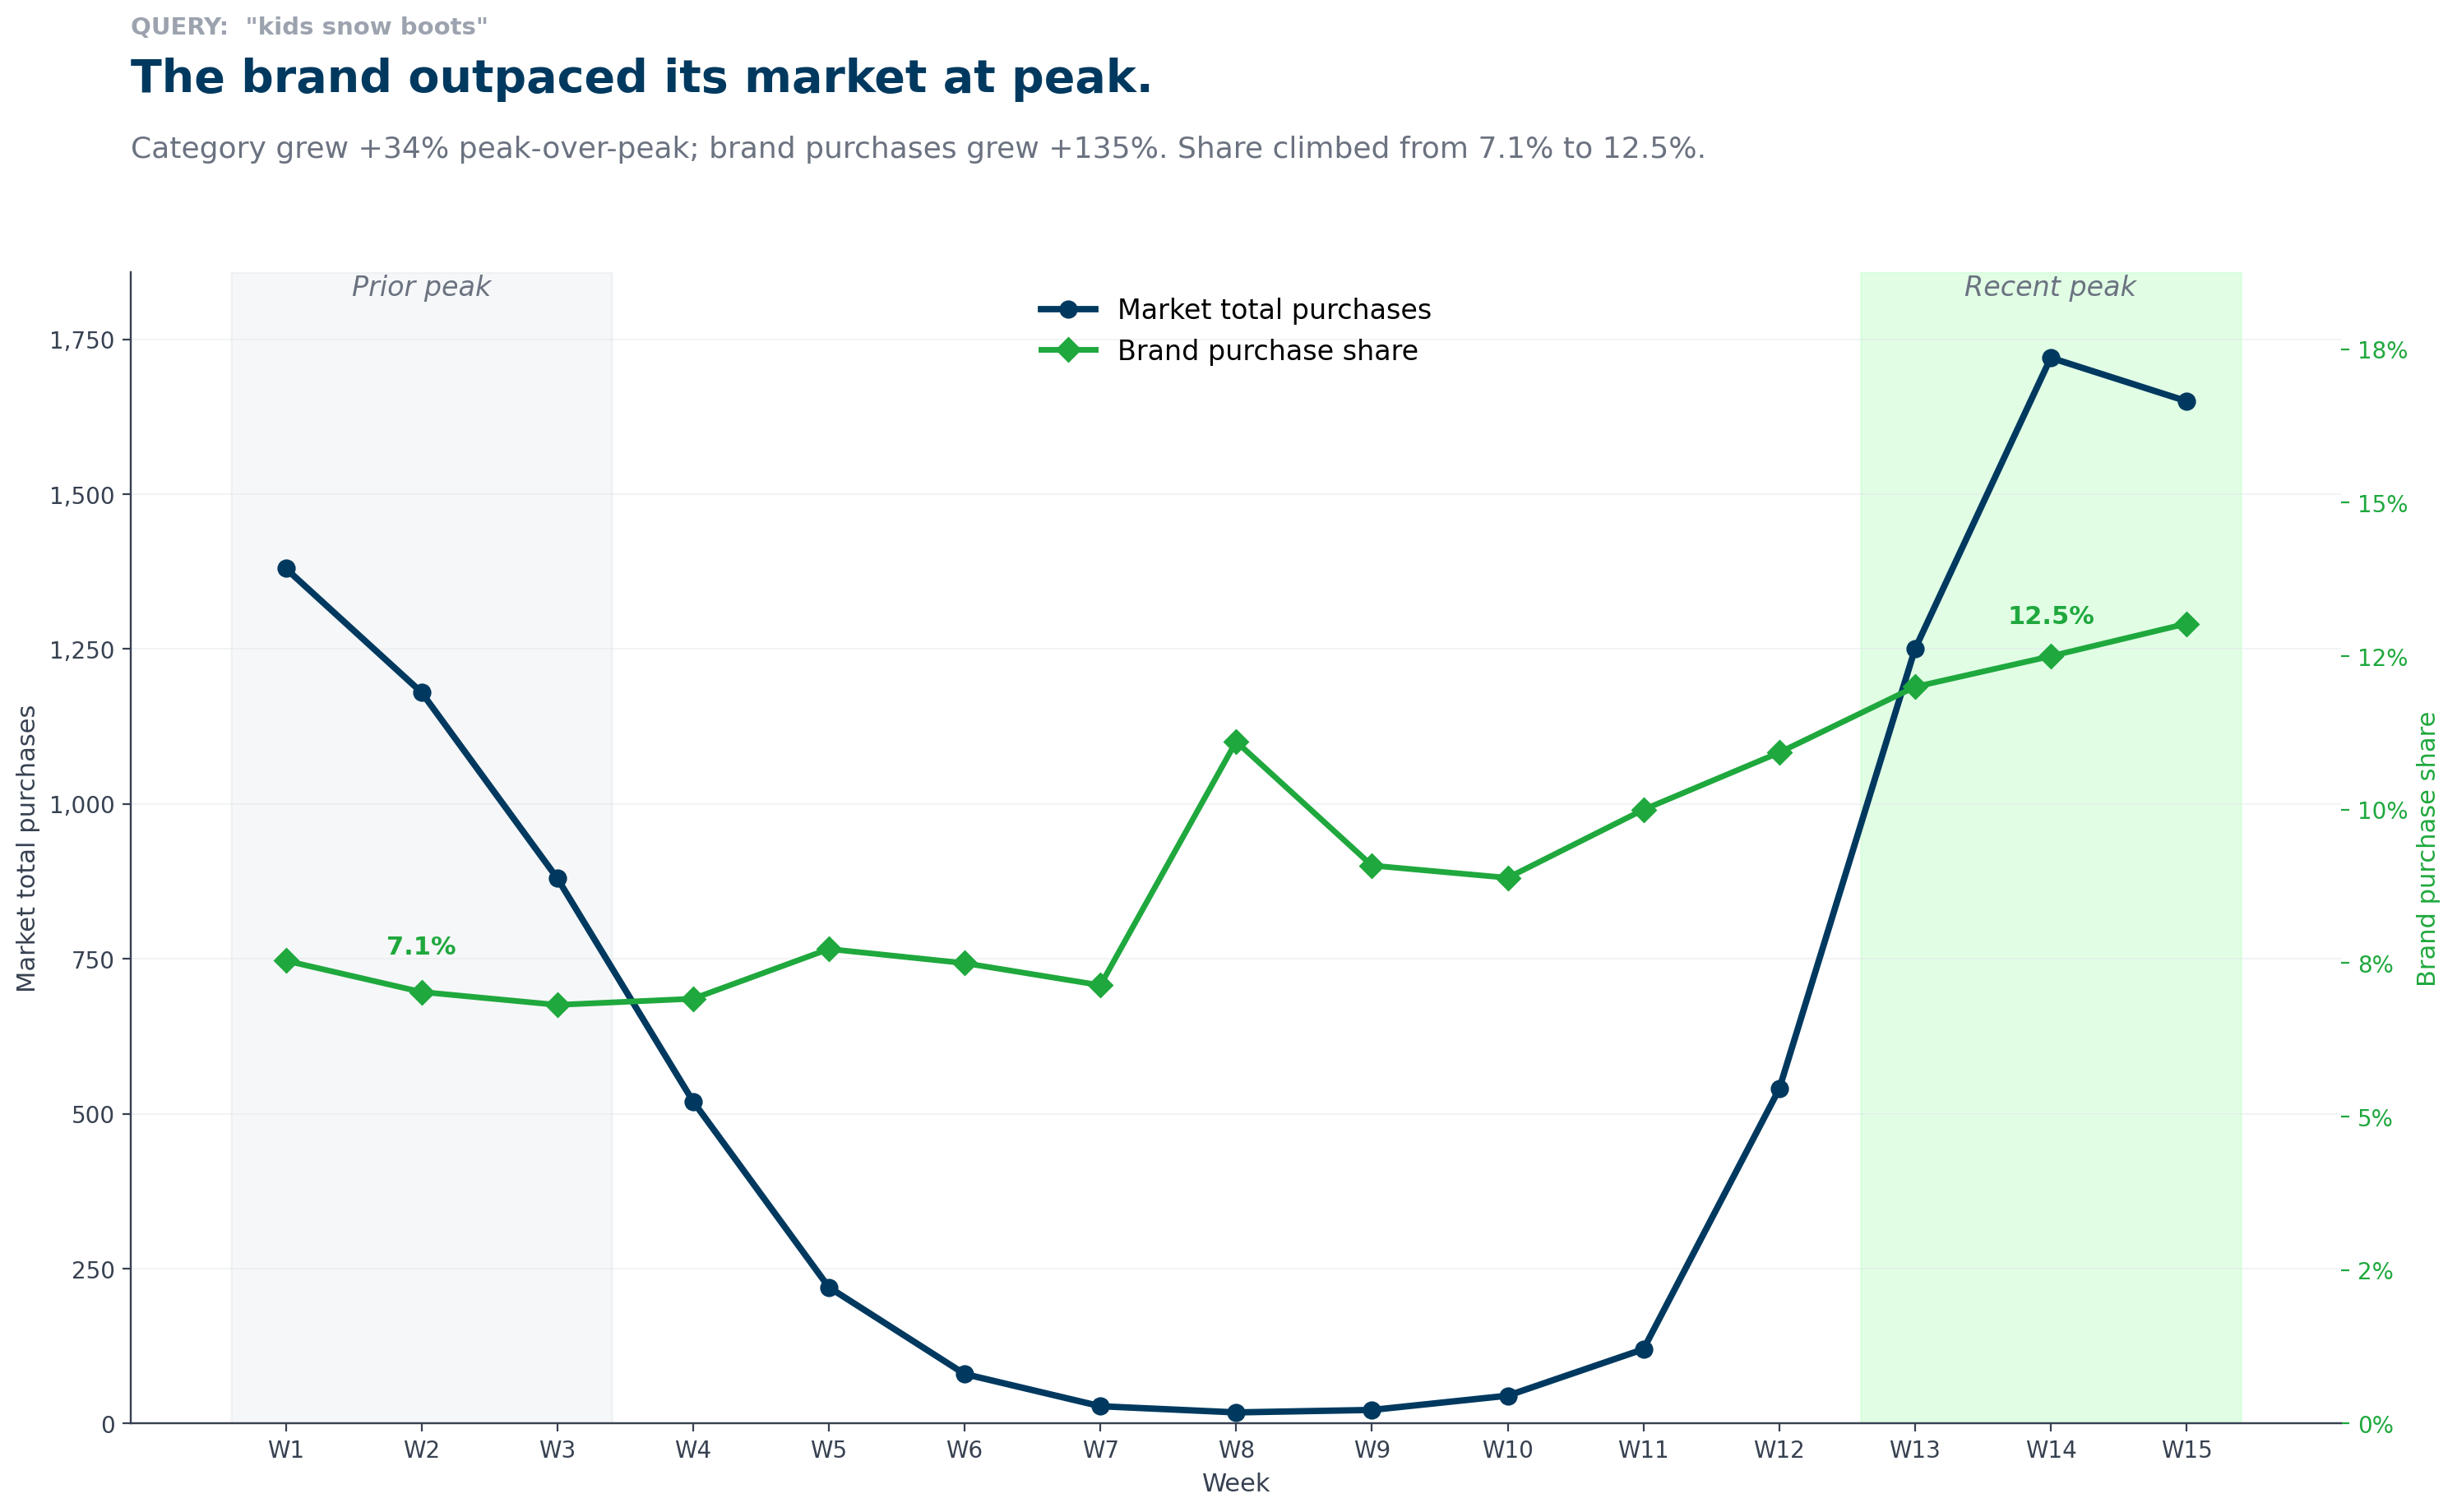
Example 3 — Peak-season growth. A deeply seasonal category swells roughly 60× from summer trough to winter peak. Peak-over-peak, the category itself grew +34%. The brand grew +135%. Share on the category-defining query climbed from 7.1% to 12.5% during the three-week peak. A rank tracker reports "position unchanged." SQP reports a materially larger slice of a materially larger pie, at the moment it mattered most.
Two forces make this framework more important, not less, going forward.
Rufus is starting to surface. Amazon has begun giving brands early access to Rufus prompt data — the conversational queries shoppers type into Amazon's AI shopping assistant. Today, the reasonable assumption is that those prompts still map back to classical queries and flow into SQP's market-share totals. Over time that will evolve. Conversational search fragments into longer, more specific, higher-intent phrases than keyword search ever produced. "stainless steel water bottle" becomes "an insulated bottle that keeps coffee hot for an 8-hour shift and fits a car cup holder." Ranking matters less and less in that world.
But the specific queries will fragment; the underlying markets will persist. Whoever's measuring share of demand — whether that demand arrives via typed search, Rufus prompts, or whatever comes after — stays oriented. Whoever's measuring rank loses the plot entirely.
Markets move in seasonal bursts. Categories don't rise and fall on smooth trends. They spike. Back-to-school compresses months of demand into a three-week window. Halloween costumes barely exist as a market for eleven months of the year, then briefly become one of the largest categories on Amazon. Christmas gifting reshapes every consumer category from October through mid-December. A rank tracker cannot tell you that your category is ten times its normal size this week — but SQP's Total Count will, and your Brand Count next to it tells you whether you captured the seasonal swell or let it pass. Brands that don't track absolute market size miss the biggest opportunities their category ever gives them.
We built Autopilot around this thesis. For every product that's enrolled in our optimizations, we operate directly on SQP-derived market share — impression, click, cart-add, and purchase share — at the query level, weekly, both branded and unbranded.
When we evaluate a listing update or a keyword for an ad campaign, we're not asking "did rank improve?" We're asking:
This reframing changes what we optimize, which clients we take, and how we report. Every brand we work with gets a share-based scorecard, not a rank dashboard.
Rank tracking measured a proxy of a proxy, in a noisy way, from outside Amazon, in an era when the SERP was more representative of the business than it is now. It was a sensible tool for its time.
Market share via SQP measures outcomes at four funnel stages, from inside Amazon's own data, and decomposes your business into share and market size — the two variables you actually need to manage.
If you're still running your Amazon business on rank, you're doing 2016's work with 2026's stakes. The data is already sitting in your Brand Analytics tab. The only question is whether you're using it.